Standard deviation is a simple measure of the variability of a data set. When used for analyzing deposits, standard deviation tests can indicate how far from the mean, or average, a particular deposit value is for a specific end user.
A low standard deviation for an end user indicates a deposit history without much variance from the mean amount. A high standard deviation indicates a high degree of variance in deposits amounts.
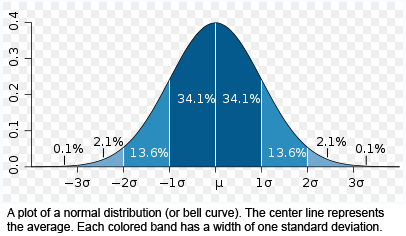
A Standard Deviation Factor is simply a multiplier of standard deviation. As illustrated in Figure 1 below, a standard deviation factor of 1 includes 68% of average deposit activity, a factor of 2 includes 95% of average deposit activity, and a factor of 3 includes 99% of average deposit activity (assuming a “normal” distribution of deposit amounts).

Figure 1
To test a deposit against standard deviation using the supplied factor, the following formula is used:
DepositAmount > MeanAmount + (StandardDeviation x StandardDeviationFactor)
For example, if the MeanAmount is $200, StandardDeviation is $150, and StandardDeviationFactor is 3, then deposits greater than $650 (200 + [3 x $150]) will be flagged for review.
Standard deviation tests are most effective when an end user has built up deposit history. Therefore, combining this test with the First n Review test is a logical plan.
Learn more about standard deviation by visiting the following sites:
http://www.techbookreport.com/tutorials/stddev-30-secs.html
http://en.wikipedia.org/wiki/Standard_deviation
There are several types of standard deviation factors that can be used to identify deposit trends, and flag a deposit for automatic review if it falls outside of the end user's normal depositing activity.

Deviation Factor - Per Deposit: By default, this feature is disabled. To enable, enter a deviation factor to be used for identifying deposits that fall outside of the normal activity for individual deposits.
Deviation Factor - Per Day: By default, this feature is disabled. To enable, enter a deviation factor to be used for identifying deposits that fall outside of the normal deposit activity per day.
Deviation Factor - Per Month: By default, this feature is disabled. To enable, enter a deviation factor to be used for identifying deposits that fall outside of the normal monthly deposit activity.
Deviation Minimum Amount: Represents the low dollar threshold at which standard deviation tests will be ignored. I.e., deposits below this amount will not be flagged for review. By default, this feature is disabled. To enable, enter an amount greater than zero ($0.00).
| Step 1. Work out the average (mean value) of your set of numbers | |||||||||
| Example 1 |
Example 2 |
||||||||
| Mean Calculation | |||||||||
| Number 1 | 100 | 110 | |||||||
| Number 2 | 200 | 250 | |||||||
| Number 3 | 300 | 325 | |||||||
| Number 4 | 400 | 475 | |||||||
| Number 5 | 500 | 590 | |||||||
| TOTAL | 1,500 | 1750 | |||||||
| Mean Amount | 300 | (Average) | 350 | ||||||
| Step 2. Work out the difference between each number and the mean | |||||||||
| Difference (Between Mean and Amounts) | |||||||||
| Number 1 | 200 | 240 | |||||||
| Number 2 | 100 | 100 | |||||||
| Number 3 | 0 | 25 | |||||||
| Number 4 | 100 | -125 | |||||||
| Number 5 | 200 | -240 | |||||||
| Step 3. Square the differences | |||||||||
| Differences - Squared | |||||||||
| Number 1 | 40,000 | 57,600 | |||||||
| Number 2 | 10,000 | 10,000 | |||||||
| Number 3 | 0 | 625 | |||||||
| Number 4 | 10,000 | 15,625 | |||||||
| Number 5 | 40,000 | 57,600 | |||||||
| Step 4. Add up the square of all the differences | |||||||||
| Squared Amounts - Total | 100,000 | 141,450 | |||||||
| Step 5. Divide this by one less than the number of numbers in your set - this is called the variance | |||||||||
| Variance | 25,000 | 35,362.50 | |||||||
| Step 6. Take the square root of the variance and you've got the standard deviation | |||||||||
| Standard Deviation | 158.113883 | 188.049196 | |||||||
| Factor Illustration - Example 1 | |||||||||
| Mean | 300 | ||||||||
| Standard Deviation | 158 | (Rounded) | |||||||
| Factor = 1 | 458 | (Equals Mean+[StdDev x 1]) | |||||||
| Factor = 2 | 616 | (Equals Mean+[StdDev x 2]) | |||||||
| Factor = 3 | 774 | (Equals Mean+[StdDev x 3]) | |||||||
| Factor Illustration - Example 2 | |||||||||
| Mean | 350 | ||||||||
| Standard Deviation | 188 | (Rounded) | |||||||
| Factor = 1 | 538 | (Equals Mean+[StdDev x 1]) | |||||||
| Factor = 2 | 676 | (Equals Mean+[StdDev x 2]) | |||||||
| Factor = 3 | 864 | (Equals Mean+[StdDev x 3]) | |||||||